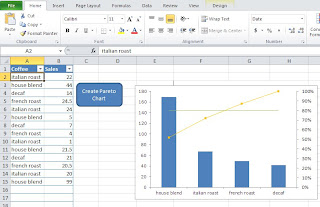
I've been gone a while working on a new template. This one is will allow you to import or enter data into an excel spreadsheet and create a pareto chart. I also wrote an article about how/when to use a pareto chart
Simply enter (or import) data into columns A and B. A should be your data to group by and B should be the values. No need to sum the data prior to importing it. The tool will do that for you. Please check it out. Let me know if you find it useful.
if we're going to follow the true specifications of a pareto chart, the height of the Primary Y axis should be fixed to reflect the sum of all the frequencies - this way, we will be able to see if the pareto principle truly holds. that is, to separate the vital few from the trivial many.
otherwise, if we use the default/dynamic maximum value under axis options, the graph can be misleading and might put great importance on the supposed tallest bar (vital few) when no significance is warranted.
if we're going to follow the true specifications of a pareto chart, the height of the Primary Y axis should be fixed to reflect the sum of all the frequencies - this way, we will be able to see if the pareto principle truly holds. that is, to separate the vital few from the trivial many.
ReplyDeleteotherwise, if we use the default/dynamic maximum value under axis options, the graph can be misleading and might put great importance on the supposed tallest bar (vital few) when no significance is warranted.
I have been using creately diagram software to create pareto charts. It can create various charts such as org chart software as well.
ReplyDelete