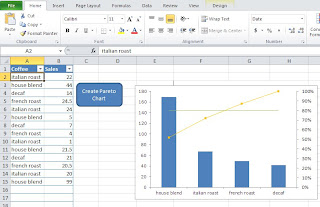
I've been gone a while working on a new template. This one is will allow you to import or enter data into an excel spreadsheet and create a pareto chart. I also wrote an article about how/when to use a pareto chart
Simply enter (or import) data into columns A and B. A should be your data to group by and B should be the values. No need to sum the data prior to importing it. The tool will do that for you. Please check it out. Let me know if you find it useful.
I ran across this post the other day. It's an old post but a cool concept for anyone creating dashboards in Excel. You can actually use some of the concepts in Microsoft Reporting Services as well.